Oscilloscope with JavaScript
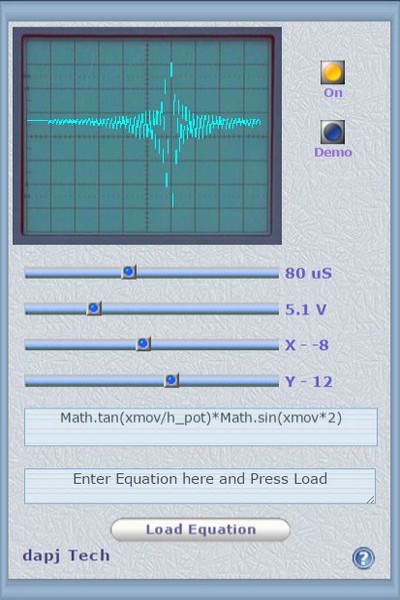
This is a Toy Scope or a waveform display which i will integrate with my other tutors to display AC points in place of voltmeters. The Oscilloscope is a Real Time Graph of Volts Y and Time X at any node of a circuit. It can show both AC and DC. This is a Virtual JS Oscilloscope - Fourier Series Periodic Waveforms using JavaScript.
Presently you can play with it. Power On and keep pressing the demo button give a few seconds between presses, to see all the waveforms stored. Tweak the four pots all you want, to understand something of this ancient electricity visualization apparatus.
Write an equation similar to the Nine demo waveforms. It has to be Javascript Math only. This scope “API” has few variables you can use in equation.
| xmov | x axis | horizontal value |
| h_pot | x gain | horizontal gain or Attenuation |
| v_pot | y gain | vertical gain or Attenuation |
Oscilloscope Functions and Fourier Series. Periodic Waveforms. Watch Sine, Square, Triangle and Sawtooth Waves and Study Controls.
Load an equation of your own and see it as a waveform on this web scope. Paste a Formula in the Equation text box, load it, it will be rendered as waveform on scope.
Just turn it on and then press demo button for 1st Waveform and Press again the demo button for 2nd Wave and so on. Still working on formulas. Slide all the pots and see what happens.
An Oscilloscope Simulation using CSS and JavaScript. Pixel Graphics based Function or Waveform Reader.
Oscilloscope GUI Improved. More waveforms added. x and y position pots added. Sine, Square, Triangle and Sawtooth Fourier Series Periodic Functions working.
I will now try integrating with a IC simulation. The API is just the Equation text box. The equation can be loaded and rendered as waveform on scope.
ee-tutors - delabs-videos -